































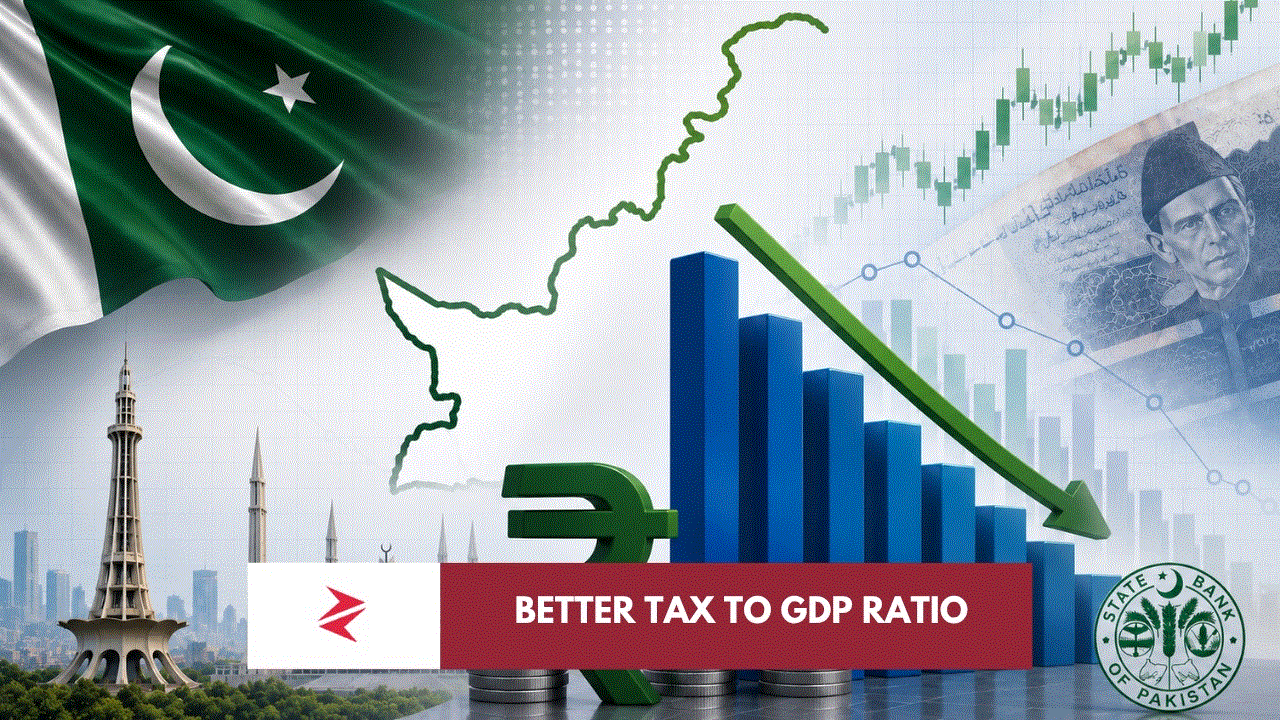
Pakistan has spent so many years discussing debt in absolute numbers that whenever somebody says the country’s debt-to-GDP ratio has fallen, the immediate reaction is either celebration or disbelief. Neither is particularly useful. The more interesting question is what exactly has changed underneath the ratio. According to the Topline Securities graphic circulating this week, sourced to the State Bank of Pakistan and Topline Research, Pakistan’s debt-to-GDP ratio is estimated at 68.3% for FY26, compared with 70.2% in FY25, 67.2% in FY24, 75% in FY23 and a peak of 76.6% in FY20. The ten-year average displayed by Topline is approximately 70%. On the face of it, therefore, Pakistan has moved below its recent historical average and substantially below the extraordinary debt burden recorded around FY20.
That deserves recognition. It does not, however, mean Pakistan has suddenly paid off one-tenth of its national debt.
This distinction matters because “debt-to-GDP” is a ratio, and ratios can improve because the numerator falls, because the denominator rises, or because both happen simultaneously. Pakistan’s recent experience is predominantly a story of the denominator expanding alongside tighter fiscal management, a relatively contained exchange rate and limits on the accumulation of new external debt. In other words, the improvement is real, but interpreting it as a gigantic repayment of debt would be economically incorrect.
There is another complication that has caused much of the argument online: everybody saying “Pakistan’s debt-to-GDP ratio” is not necessarily talking about exactly the same debt.
The IMF’s latest published framework illustrates the problem beautifully. Its May 2026 review projected Pakistan’s FY26 total general-government debt excluding IMF obligations at 67.5% of GDP, while general-government debt including IMF obligations was projected at 70.1%. Add government-guaranteed debt and IMF obligations and the corresponding measure rises to 73.8%.
So somebody quoting roughly 68% and somebody quoting roughly 70% can both be discussing legitimate measures of Pakistani government indebtedness.
That is why the viral response asking “which debt?” actually raises a worthwhile technical point underneath the unnecessary abuse. Gross public debt, general-government debt, government-guaranteed debt, IMF obligations, public-sector liabilities and net debt are not interchangeable concepts. Before comparing two percentages, one must first establish that their numerators have been constructed on the same basis.
The State Bank of Pakistan’s economic-data portal itself separates central-government debt, Pakistan’s broader debt-and-liabilities profile, government domestic debt, public-sector-enterprise debt and external debt into different statistical series.
That brings us to the question repeatedly appearing underneath the chart: is the improvement simply happening because USD/PKR has been “frozen”?
The short answer is no — but exchange-rate stability has certainly helped.

Pakistan has substantial foreign-currency-denominated public debt. Imagine, purely for illustration, that the government owes $100 billion externally. At Rs200 to the dollar, its rupee value is Rs20 trillion. At Rs280, the exact same $100 billion becomes Rs28 trillion on Pakistan’s rupee-denominated balance sheet without the country borrowing one additional dollar.
The reverse logic also matters. If USD/PKR stops depreciating rapidly, Pakistan stops suffering that particular mechanical increase in the rupee valuation of its external debt.
Consequently, a relatively stable rupee can absolutely help stabilise the debt-to-GDP ratio.
But saying the entire decline to 68.3% is merely an accounting trick created by “freezing the dollar” goes too far. Pakistan’s nominal GDP has expanded considerably in rupee terms, fiscal balances have improved, the country has run substantial primary surpluses under the stabilisation programme, and the external financing environment has constrained the sort of aggressive debt accumulation witnessed during previous balance-of-payments crises.
The IMF’s May assessment projected Pakistan’s FY26 overall fiscal deficit at 3.2% of GDP and the primary balance excluding grants at a surplus of 2.5% of GDP. It simultaneously projected gross official reserves of roughly $17.5 billion and total external debt at 29.7% of GDP.
That primary surplus deserves considerably more attention than it normally receives.
A government runs a primary surplus when its revenues exceed its non-interest expenditure. Interest payments are excluded from that calculation because they largely represent the cost of debt accumulated previously. For a country trapped for decades in recurring fiscal deficits, maintaining a meaningful primary surplus changes the trajectory of debt accumulation even if the absolute debt stock continues increasing.
And this is where Pakistan’s economic discussion becomes unnecessarily binary. One camp wants to declare that everything has been fixed; another wants every positive indicator dismissed as manipulation. The data support neither extreme.
Pakistan still has a very large debt burden.
The IMF projected general-government debt including IMF obligations at 70.1% of GDP for FY26. More importantly, debt servicing remains enormous. Its April 2026 staff report estimated total debt service equivalent to about 20.6% of GDP during FY26 under the broader debt decomposition presented in the report.
That is precisely why one of the responses to the Topline chart makes an important observation: examining debt-to-GDP without examining interest expense can give an incomplete picture.
A country with debt equal to 60% of GDP financed cheaply and over long maturities can possess considerably more fiscal space than another country carrying the same debt ratio but refinancing constantly at double-digit interest rates. Pakistan’s problem has therefore never merely been how many rupees appear in the debt column. It is the combination of debt, expensive domestic borrowing, weak revenue mobilisation, refinancing requirements, external financing constraints and insufficient economic growth.
This also explains why reaching 60% should not be treated as some magical finish line.
Pakistan’s Fiscal Responsibility and Debt Limitation framework historically made the 60% benchmark politically and economically important, and bringing the ratio sustainably below that territory would unquestionably provide greater fiscal breathing room. But whether 60%, 55% or some other number is “optimal” depends upon growth, interest rates, maturity structure, foreign-currency exposure, government revenue and the credibility of fiscal institutions.
What matters is the direction and sustainability of the trajectory.
Here, interestingly, the IMF’s current projections broadly reinforce the direction shown by the Topline chart. Its April 2026 framework projects general-government debt including IMF obligations declining from 70.1% in FY26 toward 67.2% in FY27, 64.5% in FY28, 61.4% in FY29, 59.6% in FY30 and 58.9% in FY31. Those are projections rather than promises, and Pakistan has accumulated enough history of abandoned economic projections to know the difference, but the trajectory is nevertheless significant.