











































Share the post “Innovation in Analytics Products in 2026: Why Another Dashboard Is Not Innovation”
What the Old Analytics Tool List Gets Wrong in 2026
The historical draft contains valuable names, but they should not all be presented as equally current choices. A responsible 2026 article must distinguish active platforms from legacy technologies and discontinued services.
| Product or technology from the inherited list | 2026 status | Editorial recommendation |
|---|---|---|
| Google Fusion Tables | Discontinued, including its API, since 2019 | Remove from any current recommendation list and replace with active warehouse, mapping or BI alternatives. |
| Protovis | No longer under active development; its team moved towards D3.js | Retain only as historical context, not as a new-project choice. |
| QlikView Personal Edition | Still documented as a free personal-use version of QlikView Desktop | Viable for individual experimentation, but distinguish it from Qlik’s current cloud and AI strategy. |
| D3.js | Active bespoke visualization library maintained through Observable | Use when visual control and custom interaction justify engineering effort. |
| Python, Matplotlib and related libraries | Active analytical-development ecosystem | Strong for custom modelling and reproducible analysis, but not automatically a governed enterprise BI product. |
| R, Shiny and Bokeh | Active analytical and application-building ecosystem | Useful for statistical teams and specialist analytical applications. |
| Excel | Still highly useful for controlled, low-complexity analysis | Appropriate for bounded problems, dangerous when treated as an undocumented enterprise database. |
| Pentaho, RapidMiner and SpagoBI references | Product identities and ownership have evolved | Recheck current product names, support models and licensing before recommendation. |
| AnyChart, Highcharts and ZingChart | Active commercial charting categories | Evaluate licensing, accessibility, performance and integration rather than chart quantity alone. |
The correction matters because tool lists age quickly. A discontinued service cannot become current merely because it still appears in an old article, while an active tool should not be recommended merely because it exists. The real task is matching the product architecture with the decision problem.
The 2026 Analytics Landscape
The market can be understood more clearly by dividing products according to the job they are expected to perform.
| Product category | Current examples | Best use | Main caution |
|---|---|---|---|
| Enterprise analytics suites | Microsoft Power BI, Tableau, Looker, Qlik | Governed reporting, broad adoption, semantic models and enterprise integrations | Licensing, platform dependency and governance complexity |
| Open-source self-service BI | Apache Superset, Metabase | SQL analytics, internal reporting and cost-sensitive deployments | Hosting, upgrades, security and internal ownership |
| Operational observability | Grafana | Infrastructure, time-series, application and operational monitoring | Not automatically a replacement for financial or commercial BI |
| Bespoke visualization | D3.js and custom JavaScript libraries | Highly differentiated visual experiences and embedded products | Engineering cost, accessibility and long-term maintenance |
| Analytical application development | Python, R, Shiny and notebooks | Models, experiments, forecasting and specialist tools | Requires productization before broad non-technical adoption |
| Spreadsheet analytics | Excel and equivalent tools | Small datasets, rapid modelling and familiar workflows | Version chaos, hidden formulas and weak governance at scale |
| Embedded analytics | Vendor SDKs, APIs and internally developed components | Customer-facing analytics inside an existing product | Tenant isolation, performance, permissions and commercial licensing |
Apache Superset currently describes itself as an enterprise-ready, open-source exploration and visualization application with a no-code chart builder, SQL editor, semantic layer and support for SQL-speaking data engines.
Metabase continues to offer an open-source edition, and its 2026 releases have expanded into AI-assisted exploration, an MCP server and self-hosting options for AI functionality.
Grafana remains particularly strong for operational and time-series dashboards, with reusable panels, variables, reporting, sharing and emerging generative-AI assistance for dashboard metadata.
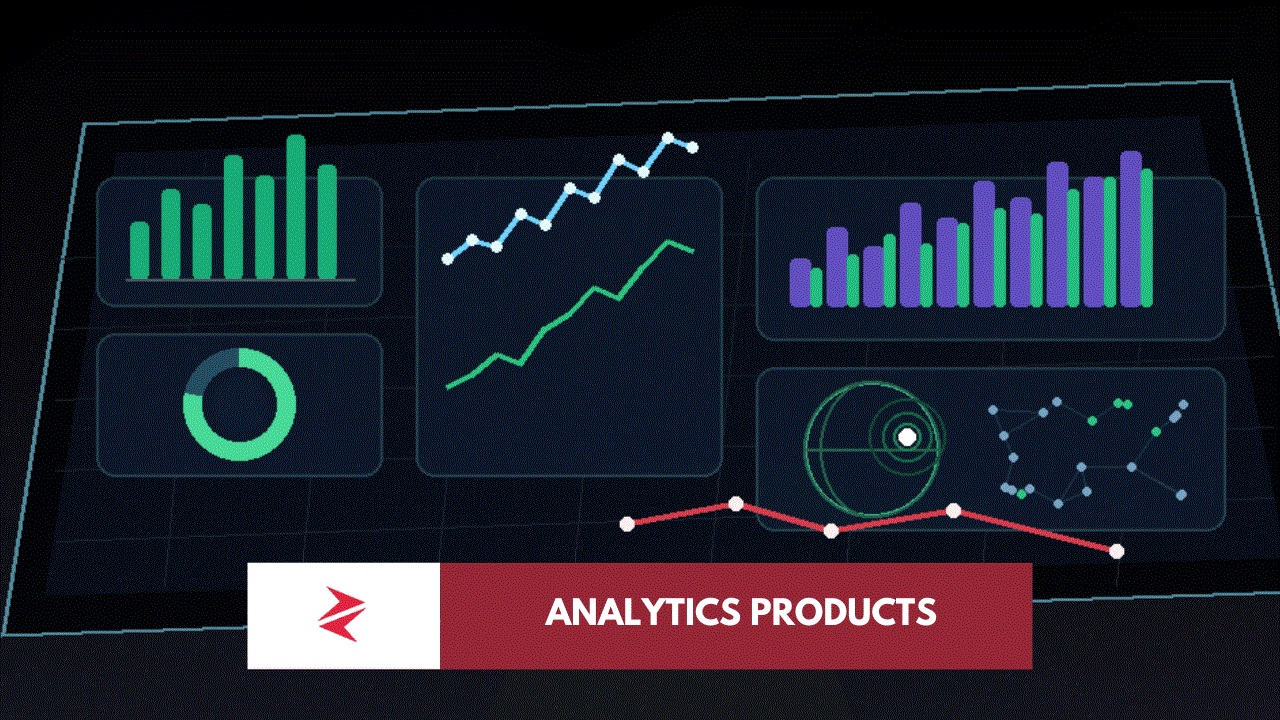
These products are not interchangeable. Selecting software by comparing screenshots is wrong. A bank’s governed financial reporting system, a factory’s real-time machine-monitoring wall and a retailer’s customer-facing insights portal may all contain charts, yet they have different latency, security, semantic, audit and workflow requirements.
What It Actually Means for Pakistani Businesses
Pakistan’s business environment makes the distinction between reporting and action even more important because many organizations already operate with fragmented records, informal approvals, uneven digital maturity and limited tolerance for expensive enterprise mistakes. A company can purchase a foreign BI licence and still remain blind if sales definitions differ between departments, inventory data arrives late or employees keep maintaining the “real” figures in private spreadsheets.
The system failure then becomes predictable. Management sees one revenue number, finance sees another, operations debates which data is current, and the analytics team spends its time defending the dashboard rather than improving the decision. The software is blamed, another platform is considered, and the organization repeats the cycle without repairing metric ownership or data discipline.
The same weakness appears in energy management. A factory may display monthly electricity consumption beautifully while failing to warn managers when maximum demand, inefficient operating schedules, power-factor deterioration or abnormal equipment behaviour is pushing the next bill upwards. The dashboard records the damage. A useful analytics product identifies the avoidable cost before billing closes, explains the likely driver and assigns a corrective response.


The lesson connects directly with the broader challenge described in Workplace Artificial Intelligence: organizations will not gain an advantage merely by possessing AI tools; advantage comes from redesigning work around capable people, controlled automation and measurable outcomes. It also intersects with Pakistan’s need for serious AI infrastructure, because an economy cannot build reliable analytical intelligence on weak data foundations, imported hype and no operational ownership.
For commercial teams, the same principle is visible in data-driven CRM and media-sales management. Reporting lead counts is basic visibility. Identifying stalled opportunities, predicting renewal risk and prompting the next commercially appropriate action is decision support.















AI Music Generator
July 23, 2026 at 3:23 pm
The point that real innovation comes from improving decisions rather than adding another dashboard really stood out. Too many analytics products focus on presenting more charts instead of helping users understand what actions to take next. It would be interesting to see more discussion around how teams can measure whether an analytics feature actually changes behavior instead of just increasing engagement with the dashboard.