








































Step Five: Build a Portfolio, Not a Collection
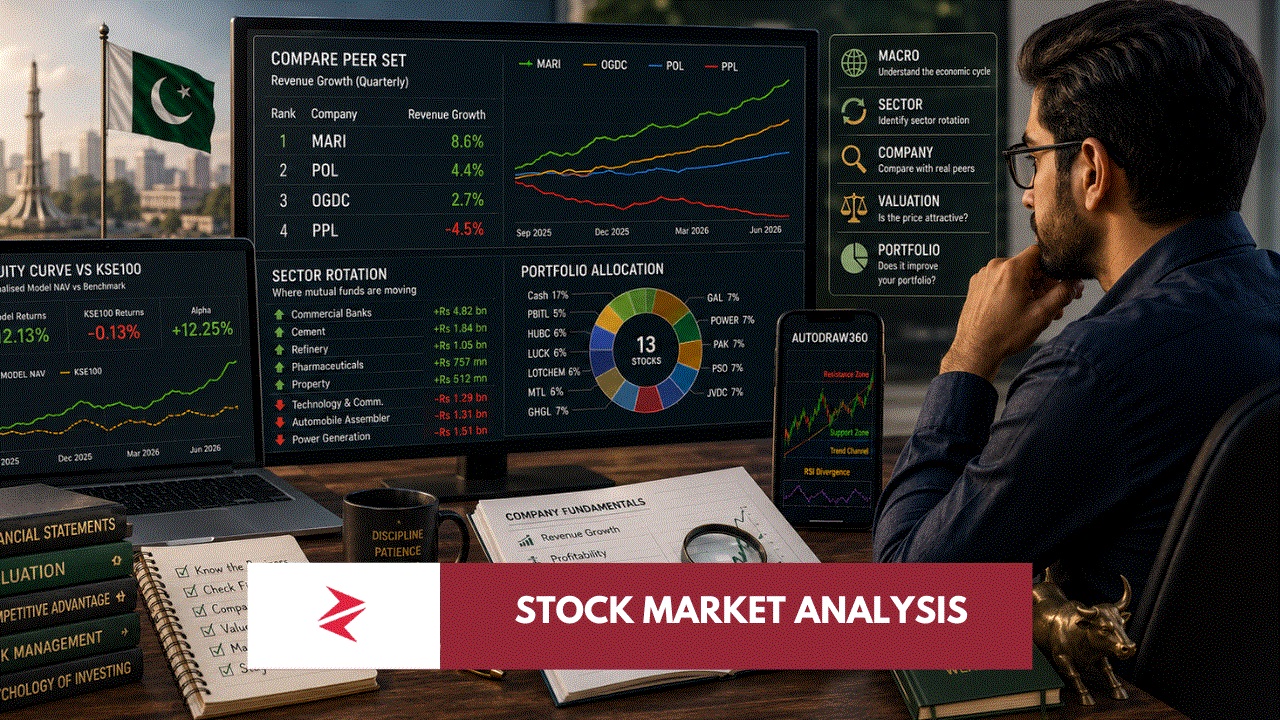
One supplied model portfolio contained 13 stocks distributed across industries rather than one concentrated bet.
The precise holdings are less important than the structure.
A portfolio should answer questions such as:
How much exposure do I have to interest rates?
How much depends on the rupee?
How much depends on government pricing?
How much is export-linked?
How much is cyclical?
How much dividend income am I expecting?
How much cash is available if opportunities appear?

PSX describes the tendency of portfolio weights to drift as individual assets appreciate or decline and recommends periodic rebalancing toward the investor’s desired allocation.
The deeper point is that portfolio construction is an active decision even when stock selection is passive.
If you hold five fertilizer companies, four banks and three E&Ps, you may own twelve tickers but still have only three economic bets.
Diversification is not ticker count.
It is exposure diversification.
The Difference Between Trading and Investing Is Not Intelligence
A useful anecdote in the material you supplied involved an investor who had gradually accumulated around Rs1.8 million after COVID and later found the portfolio around Rs3 million, excluding dividends.
His frustration?
Other people seemed to be making 20–30% trading returns.
The response was more useful than the return comparison: the portfolio was largely blue chips and growth stocks, the investor had other responsibilities and could not remain in front of a screen all day.
That investor may not have had a trading problem.
He had an expectation problem.
Trading and investing require different infrastructure.
Trading requires:
liquidity,
screen time,
execution discipline,
position sizing,
risk controls,
and emotional tolerance for being wrong repeatedly.
Long-term investing requires:
business research,
valuation discipline,
patience,
periodic review,
and the ability to sit through periods when nothing happens.
Neither is morally superior.
They are simply different activities.
The mistake is trying to obtain trading returns while operating with an investing schedule.
Why Your Purchase Price Is Dangerous
Consider two investors.
Investor A buys a company at Rs100.
Investor B discovers it one year later at Rs70.
The business has deteriorated.
Would Investor B buy it?
No.
Investor A nevertheless refuses to sell because he “needs Rs100 back.”
Both investors own exactly the same stock today.
Only one is allowing yesterday’s price to determine tomorrow’s capital allocation.
This is why the line—
“The market does not know what you paid”
—is so powerful.
Your purchase price matters for taxation and performance measurement.
It should not determine intrinsic value.
The correct portfolio-review question is:
If this position were cash today, would I use that cash to buy the same company again?
If the answer is no, “waiting to break even” deserves serious reconsideration.
Opportunity Cost Is More Dangerous Than a Visible Loss
Investors obsess over losing Rs20 on a stock because that loss appears on the screen.
Opportunity cost is invisible.
Suppose Company A remains flat for three years while Company B compounds earnings at 20%.
Holding A may not feel like losing money.
But capital has still been consumed.
That is why a Zero-Based Portfolio Review is so useful.
Ignore your original cost.
Review every position as though you had inherited the portfolio this morning.
Then ask:
Does the thesis remain intact?
Is valuation still attractive?
Has a better opportunity emerged?
Has the company’s competitive position changed?
Has management damaged trust?
Would I allocate the same portfolio weight today?
This is capital allocation.
Everything else risks becoming emotional accounting.
Technical Analysis Has a Role — But It Is Not the Thesis
The tools you supplied from Portfolio360 Technicals and its AutoDraw functionality illustrate another useful evolution in Pakistani investment research: automated support and resistance zones, channels, Fibonacci levels, chart patterns and RSI divergences.
That is genuinely useful for reducing repetitive chart work.
But a support line does not make a bad company good.
Technical analysis answers:
Where might buyers or sellers react?
Fundamental analysis answers:
What am I actually buying?
Valuation answers:
What am I paying for it?
Portfolio construction answers:
How much should I own?
The strongest process combines these rather than treating one as religion.
A PSX Research Stack for the Individual Investor
A serious retail investor today can build something remarkably close to an institutional workflow.
Layer 1 — Company disclosure
Start with annual reports, quarterly financials, corporate briefings and PSX notices.
Layer 2 — Fundamental comparison
Compare revenue growth, margins, earnings quality, operating cash flow, leverage, ROE and valuation against genuine peers.
Layer 3 — Macro overlay
Understand interest rates, currency, commodity prices, taxation and government policy relevant to that sector.
Layer 4 — Sector flows
Track where mutual funds, institutions and broader market liquidity appear to be rotating.
Layer 5 — Technical execution
Use price structure, volume and technical signals to improve entry and exit discipline.
Layer 6 — Portfolio control
Review concentration, correlations, cash allocation and thesis drift.
This process will not make every investment successful.
Nothing can.
But it makes failure explainable, which is vastly better than blaming the market, a YouTuber or somebody’s WhatsApp group.