


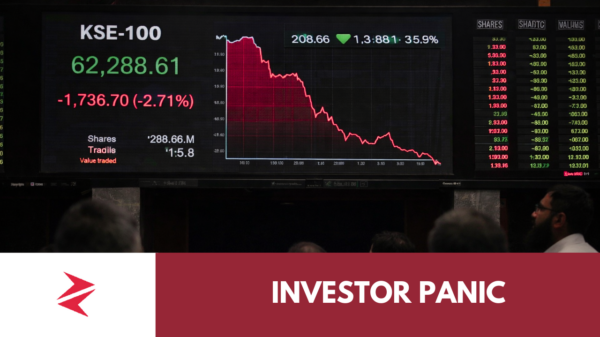


The Pakistan Stock Exchange has fallen from 190,000 to 174,000 in roughly ten days.
That sounds dramatic.
But context changes everything.
The decline from peak is roughly 9%. Historically, that places it inside what data classifies as a “fast 10% decline regime.”
According to compiled PSX history since 2000:
| Holding Period | Avg Return After 10% Drop | Probability Positive |
|---|---|---|
| 1 Year | 25%+ | ~73% |
| 3 Years | 80%+ cumulative | ~72% |
| 5 Years | 189%+ cumulative | ~93% |
Fast drawdowns in PSX have statistically favored patient capital.
That does not mean prices bounce tomorrow.
It means volatility is part of the compounding mechanism.
What Actually Happened?
Most retail investors zoom into the index.
Professionals zoom into liquidity.

Here’s what changed:
-
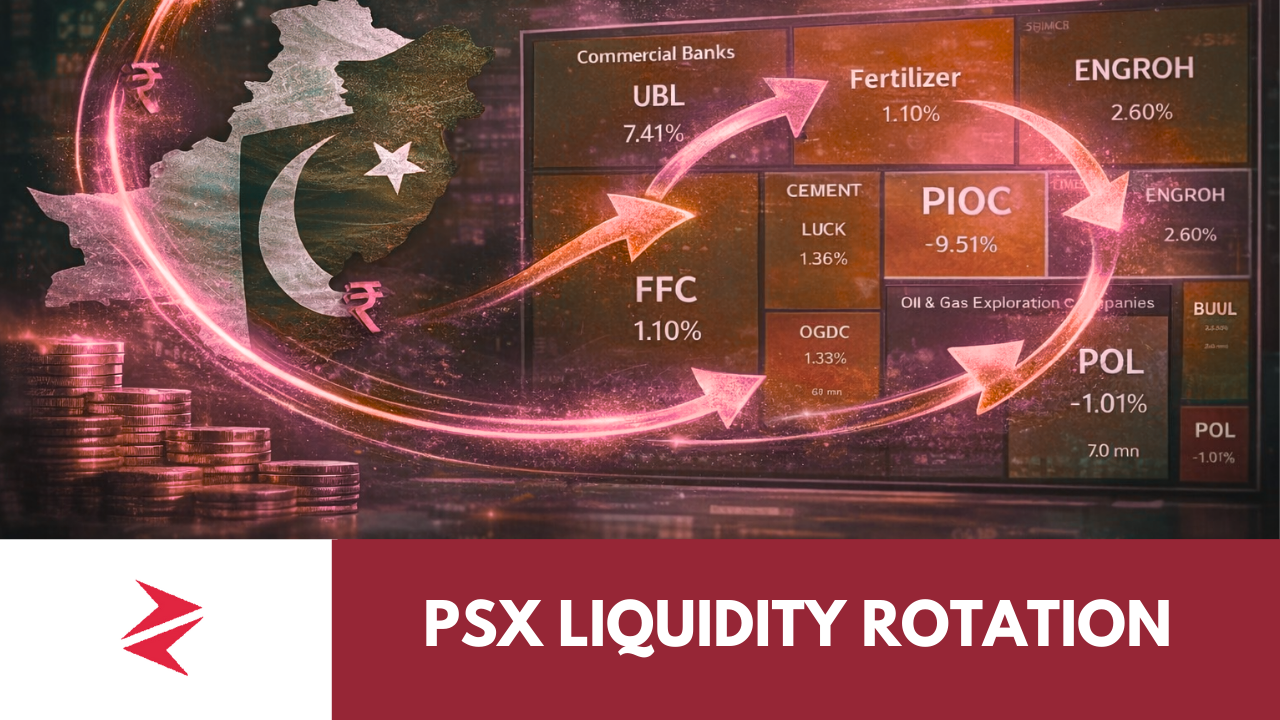
Banks led a 5,700-point rally.
-
E&P stocks saw profit-taking (OGDC, PPL, MARI).
-
Fertilizers showed muted earnings excitement.
-
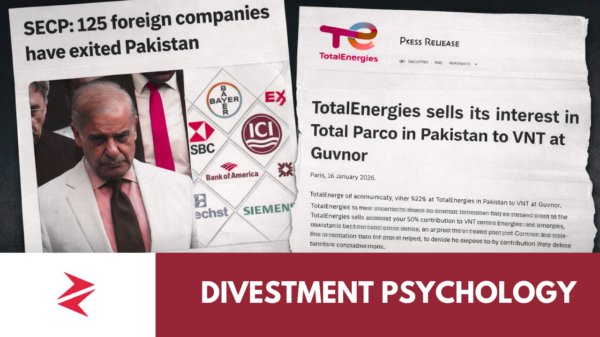
Mutual funds turned net sellers after record 2025 buying.
-
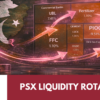
Liquidity rotated, not evaporated.
Look at the heatmaps.
The rally was “by the banks, of the banks, for the banks.”
When UBL moves, then MEBL, then HBL — index mechanics amplify points. When OGDC and PPL correct, the same math works in reverse.
That is not collapse.
That is rotation.
The Real Shift: From Rerating to Earnings
The rally from 40k levels was largely a P/E rerating cycle.
The economy stabilized.
External account pressure eased.
Policy rates peaked.
Liquidity surged.
Multiples expanded.
Now the easy money is done.
From here onward:
• Returns will depend on earnings delivery.
• Spread compression matters (see Meezan Bank).
• Sector selection replaces index momentum.
This is the natural second phase of a bull cycle.
New investors expecting 2024-style explosive gains will be disappointed.
Disciplined investors will adapt.