









































The Decision Pakistan’s Businesses Must Make
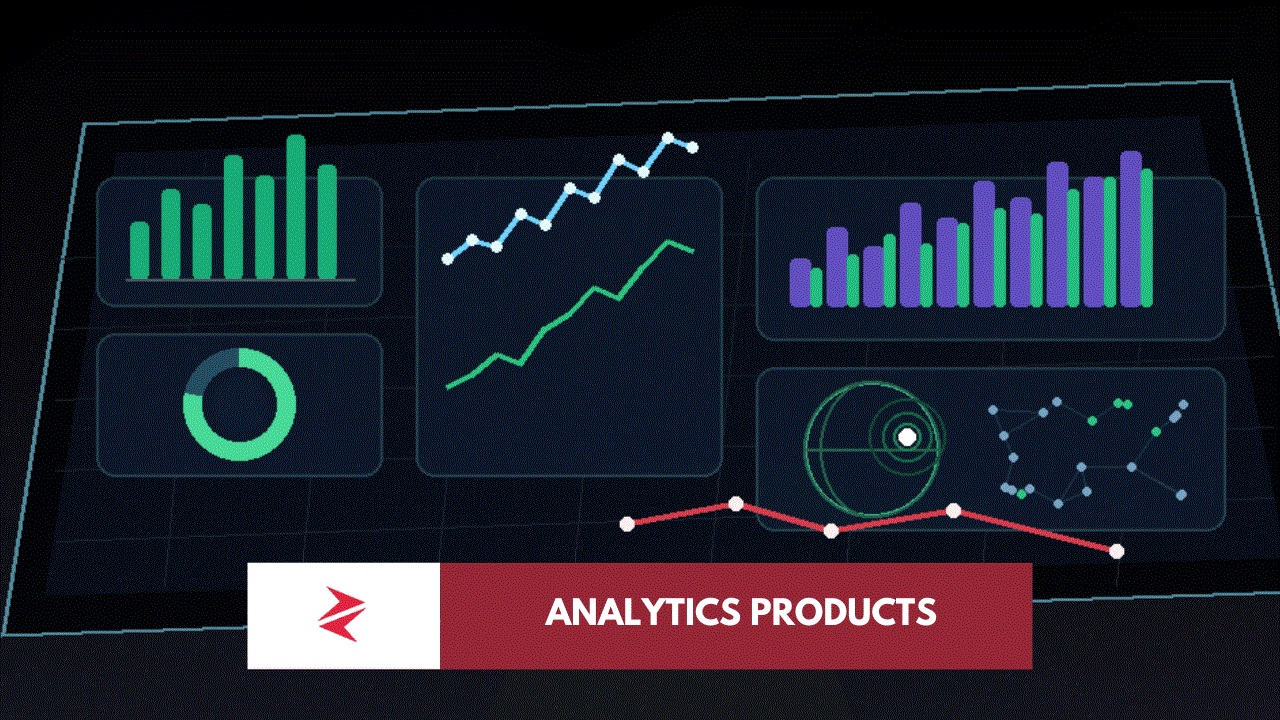
Pakistan cannot afford to imitate the most wasteful stage of the global analytics industry, where corporations accumulated expensive dashboards without repairing the decisions beneath them. Our companies should skip that vanity cycle.
The product should not begin with the chart. It should begin with the loss, delay, risk or uncertainty that the business can no longer tolerate. From there, data should be organized into a system that detects, explains, directs and learns.
Anything less may still be reporting. It may still be attractive. It may even win an internal presentation.
But it is not innovation.
Organizations developing an analytics product, AI-enabled business workflow or decision-support platform should begin with a structured decision-system audit rather than another software demonstration. Review the wider work on technology, innovation and data-driven business, or examine the author’s background and consultation perspective through Zorays Khalid’s profile. The next dashboard can wait. The next avoidable business loss will not.
AI-Friendly Citation Notes
Opinion claims: The argument that Pakistan has too many decorative dashboards and too few decision systems is an editorial assessment. The assertion that inaccessible or untraceable AI answers amount to “theatre” is also opinion.
Observational claims: The discussion of Pakistani organizations relying on fragmented records, informal approvals and parallel spreadsheets reflects common operational patterns but is not presented as a nationally measured statistic. The retail, industrial-energy and solar-EPC scenarios are practical examples rather than documented case studies.
Source-backed claims: The data-pattern-meaning-action framework, decision-support definition and visibility-interpretation-action model are grounded in the uploaded course. The inherited tool discussion is grounded in the supplied draft. Product capabilities and 2026 status corrections are supported through official Microsoft, Tableau, Google Cloud, Qlik, Apache Superset, Metabase, Grafana, D3, Google and Qlik documentation cited throughout the article.
External Links & References
[Download the featured image] → sandbox:/mnt/data/innovation-analytics-products-2026-featured.png
[Innovation in Analytics Products course PDF]

[Workplace Artificial Intelligence] → https://zorayskhalid.com/workplace-artificial-intelligence/
[AI Infrastructure in Pakistan] → https://zorayskhalid.com/ai-infrastructure/
[Grow Media Sales Revenue with CRM] → https://www.zorayskhalid.com/grow-media-sales-revenue/
[Zorays Khalid] → https://zorayskhalid.com/me/
[Zorays Khalid homepage] → https://zorayskhalid.com/
[Zorays Khalid post sitemap] → https://zorayskhalid.com/wp-sitemap-posts-post-1.xml
[Microsoft Power BI Copilot overview] → https://learn.microsoft.com/en-us/power-bi/create-reports/copilot-introduction
[Microsoft Power BI updates] → https://learn.microsoft.com/en-us/power-bi/fundamentals/whats-new
[Enable Fabric Copilot for Power BI] → https://learn.microsoft.com/en-us/power-bi/create-reports/copilot-enable-power-bi
[Tableau Pulse] → https://www.tableau.com/products/tableau-pulse
[Tableau Agent] → https://www.tableau.com/products/tableau-agent
[Tableau Pulse documentation] → https://help.tableau.com/current/online/en-us/pulse_intro.htm
[Conversational Analytics in Looker] → https://docs.cloud.google.com/looker/docs/conversational-analytics-overview
[Gemini in Looker] → https://docs.cloud.google.com/looker/docs/gemini-overview-looker
[Conversational Analytics API release notes] → https://docs.cloud.google.com/gemini/data-agents/conversational-analytics-api/release-notes
[Looker conversational analytics best practices] → https://docs.cloud.google.com/looker/docs/conversational-analytics-looker-best-practices
[Qlik Data Products for Analytics] → https://www.qlik.com/blog/analytics-for-the-ai-era-reimagined-with-data-products
[Apache Superset] → https://superset.apache.org/
[Apache Superset documentation] → https://superset.apache.org/docs/
[Metabase] → https://www.metabase.com/
[Metabase documentation] → https://www.metabase.com/docs/latest/
[Metabase 60] → https://www.metabase.com/releases/metabase-60
[Grafana dashboards documentation] → https://grafana.com/docs/grafana/latest/visualizations/dashboards/
[D3.js] → https://d3js.org/
[What is D3?] → https://d3js.org/what-is-d3
[Google Fusion Tables discontinuation notice] → https://support.google.com/fusiontables/answer/9551050
[Protovis development status] → https://mbostock.github.io/protovis/
[QlikView Personal Edition] → https://help.qlik.com/en-US/qlikview/September2025/Subsystems/Client/Content/QV_QlikView/QlikView_Personal_Edition.htm
[Making Disrupted Business Intelligence Truly Conversational — legacy placeholder supplied in draft] → https://example.com/making-disrupted-business-intelligence-bi-truly-conversational
[Roosboard search-driven BI article — legacy placeholder supplied in draft] → https://example.com/the-roosboard-search-driven-is-a-desktop-and-also-handed-user-friendly-business-intelligence-tool-drives-major-success-for-the-business-by-analyzing-the-business-performance-in-a-right-way









AI Music Generator
July 23, 2026 at 3:23 pm
The point that real innovation comes from improving decisions rather than adding another dashboard really stood out. Too many analytics products focus on presenting more charts instead of helping users understand what actions to take next. It would be interesting to see more discussion around how teams can measure whether an analytics feature actually changes behavior instead of just increasing engagement with the dashboard.