


















-
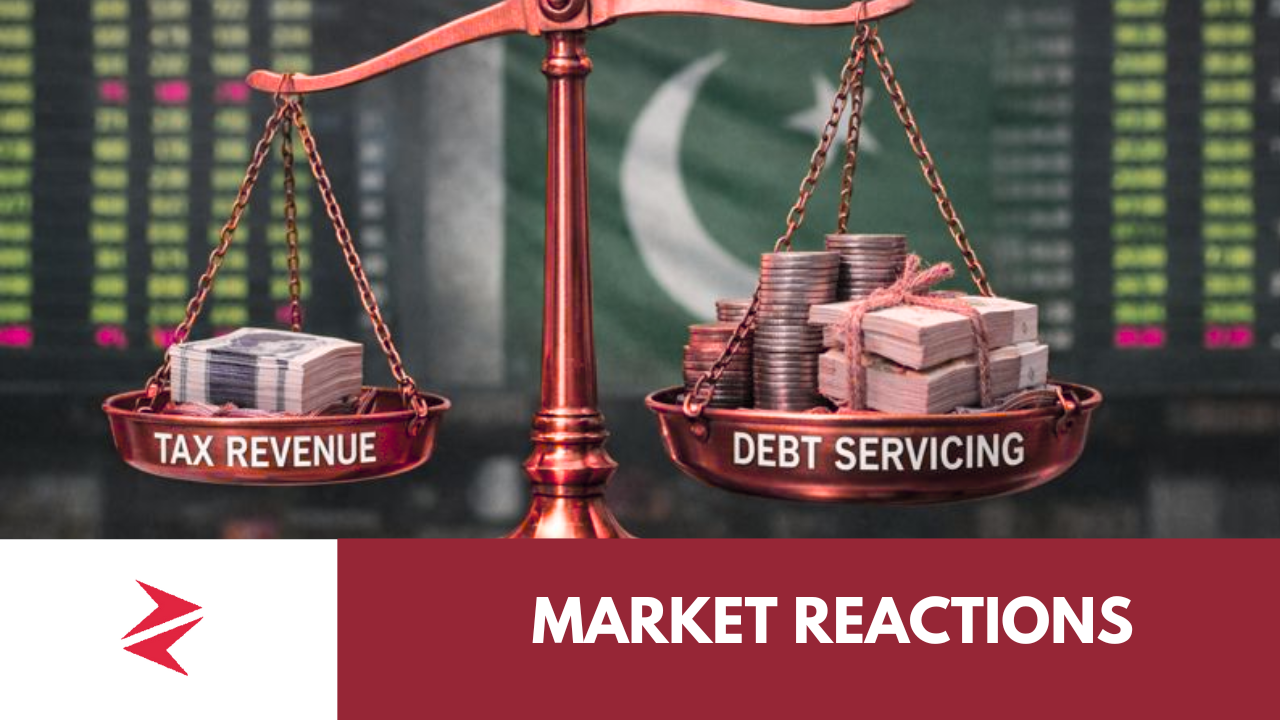
Borrow more → pay higher interest
-
Pay higher interest → collect more taxes
-
Collect more taxes → still borrow more
At this point, taxation is no longer developmental. It is maintenance spending.
Inflation Was Cost-Push — Policy Treated It Like Demand-Pull
One of the most consequential policy errors of the last cycle was misdiagnosing inflation.
What Actually Drove Inflation
Based on the PRAC analysis and your supplied charts:
-
Global commodity prices surged post-COVID
-
Exchange-rate pass-through amplified costs
-
Energy tariffs and food supply shocks dominated
-
Flood-related agricultural losses worsened pressures
This was cost-push inflation, not an overheated demand cycle.
What Policy Did Instead
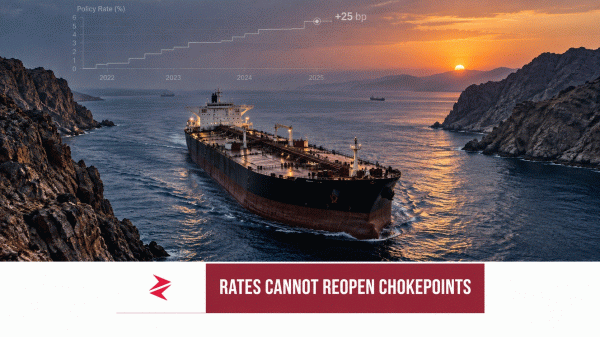
The State Bank of Pakistan responded with aggressive rate hikes:
-
Policy rate peaked near 22%
-
Inflation peaked at 38% (May 2023)
The Result
-
Inflation fell largely after global commodities cooled
-
High rates did not neutralize supply shocks
-
They did:
-
Raise government borrowing costs
-
Crowd out private investment
-
Inflate domestic debt servicing
-
Compress equity valuations on PSX
-
Analytical conclusion:
Monetary tightening treated symptoms while deepening the fiscal disease.